

Using TradingView with Deriv: A Practical Guide
🚀 Learn how to combine TradingView & Deriv for smarter trading in Nigeria. Get tips on setup, chart tools, indicators, and real-time market analysis!
Edited By
Henry Walker
Trading in the Nigerian financial markets demands sharp tools and clear insights. Using TradingView charts alongside the Deriv platform can give you that edge. TradingView offers detailed, real-time charting with versatile indicators, while Deriv provides a user-friendly interface for placing trades across forex, commodities, and assets.
Integrating TradingView charts with Deriv isn’t just flair; it helps you spot trends, understand price movements, and make informed decisions. Nigerian traders benefit especially because market volatility and naira fluctuations often create quick shifts—having reliable charts to track these changes is key.
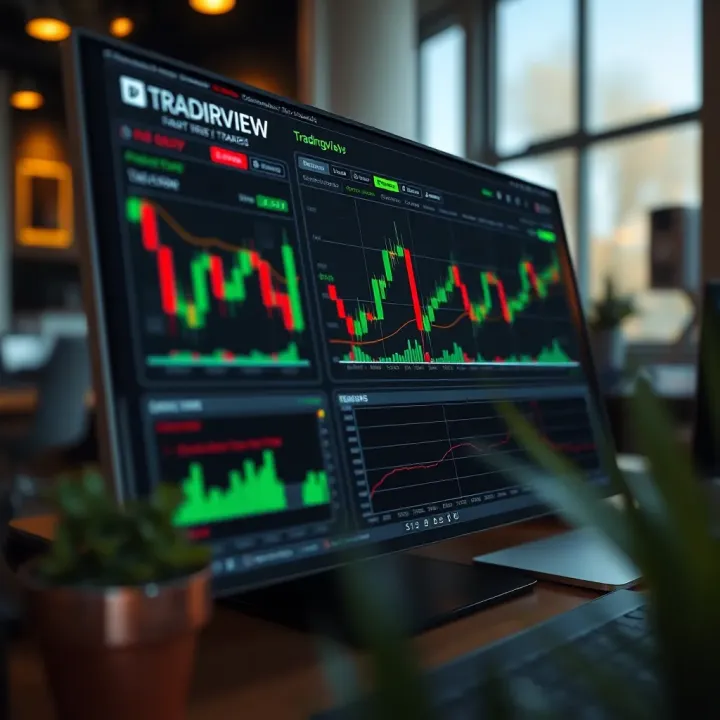
By combining these platforms, you get access to:
Real-time price data that updates faster than some native broker charts.
A wide selection of indicators like moving averages, RSI, and Bollinger Bands to gauge momentum and volatility.
Customisable chart types: candlesticks, bars, line charts, and more.
Tools to draw support and resistance, trend lines, and Fibonacci levels.
For example, if you’re trading oil contracts on Deriv, watching the Brent crude price on TradingView with pivot point indicators can help you decide the optimal entry and exit points. This reduces guesswork and improves profit chances.
Using these charts smartly means monitoring key signals without getting overwhelmed. Stick to a few trustworthy indicators and focus on patterns suited to your trading style.
The next sections will walk you through setting up TradingView charts with your Deriv account, customising them for your favourite trade types, and interpreting essential indicators that fit the Nigerian market climate. This practical approach aims to boost your trading strategy beyond basic guesswork into a methodical process.
With this groundwork, you’re ready to sharpen your trading skills, reduce risks, and potentially increase returns in a market that rewards preparedness.
To trade smartly on Deriv, understanding TradingView and how it complements the platform is essential. TradingView offers advanced charting tools and a broad ecosystem that enhances market analysis and helps traders make informed decisions on Deriv. Traders in Nigeria, dealing with volatile markets and multiple asset classes, will find this combination practical for spotting opportunities and managing risks efficiently.
TradingView provides live updating charts with smooth, responsive interfaces that traders can manipulate directly. Unlike static charts, these dynamic charts allow zooming in on specific periods or switching between multiple types, such as candlestick, bar, or line charts. For instance, a trader observing the Naira/USD exchange on Deriv can instantly see price changes and adjust strategy without lag, a crucial edge in markets where seconds count.
TradingView offers over a hundred built-in indicators ranging from simple moving averages to complex oscillators like the Relative Strength Index (RSI) and Bollinger Bands. These tools help traders understand momentum, volatility, and potential reversal points. Say you’re trading oil CFDs on Deriv; adding Bollinger Bands can reveal when price swings are overstretched, signalling possible entry or exit points.
A standout feature of TradingView is its active trader community. Users publish trade ideas, scripts, and charts, allowing others to learn from shared strategies or market outlooks. Nigerian traders can join discussions or follow local experts to gain insight into region-specific factors like oil price shifts or regulatory updates. This social aspect turns solo trading into a communal learning experience, improving decision-making over time.
TradingView’s clear graphical presentations simplify complex market data, making it easier to identify trends, support and resistance levels. For example, when trading forex pairs on Deriv, you can visually track the upward or downward trend for the day, helping avoid guesswork. This clarity supports timely decisions rather than relying on gut feelings.
Binary options and Contracts for Difference (CFDs) require precise timing; TradingView’s precise tools help spot accurate entry and exit points. Instead of relying only on numerical data, traders see price action patterns clearly, such as head and shoulders or flags. If you trade CFDs on commodities like cocoa or gold on Deriv, combining TradingView’s indicators with its chart patterns improves your accuracy in predicting price moves.
Deriv offers a range of assets including forex, commodities, indices, and cryptocurrencies. TradingView supports this diversity by letting you switch seamlessly between different markets and time intervals ranging from seconds to months. This flexibility is important when you want to trade short-term on Nigerian Naira pairs or take long-term positions on indices. Having all these options in one platform avoids shifting between several apps, helping maintain focus and improving execution.
Efficient use of TradingView charts on Deriv can spell the difference between guesswork and informed trading. Understanding these features equips you with reliable tools to navigate Nigeria’s dynamic markets confidently.
Integrating TradingView charts into the Deriv platform enhances your ability to make well-informed trading decisions. Setting up these charts correctly ensures you can analyse market movements precisely and spot trading opportunities more quickly. For traders in Nigeria, where market conditions can shift fast with local and global events, having real-time, customisable charts directly on Deriv is a practical edge.
Creating accounts on both platforms is the first step. You must have active accounts on both Deriv and TradingView. This is straightforward: on Deriv, you sign up with your email or phone number, while TradingView requires registration with a valid email and password. Having accounts on both ensures you unlock the full range of charting and trading features. For example, if you trade forex or cryptocurrencies on Deriv, having TradingView account credentials ready means you can link and sync without delay.
Linking accounts and permissions comes next. Deriv allows integration with TradingView by requesting permission to access your TradingView charts. You grant the necessary authorisation securely, so Deriv can display your TradingView settings seamlessly. This connection means your preferred indicators, chart styles, and layouts on TradingView are mirrored in the Deriv interface. Practical benefit: you avoid repetitive setup and get direct access to advanced charting tools while placing trades on Deriv’s platform.
Navigating to TradingView charts within Deriv follows the linking process. Once connected, you access TradingView charts through the Deriv trading interface under a dedicated chart section or pop-up window. This smooth navigation saves time—you don’t have to switch between tabs or apps when evaluating market signals. For example, switching from watching a candlestick pattern to executing a CFD trade happens without losing focus.
Choosing chart types and time intervals within TradingView on Deriv is vital. Traders can select from line charts, candlesticks, or bar charts depending on their strategy. Time intervals range from one minute to monthly views. For instance, a scalper may choose 5-minute candlestick charts for quick entry and exit points, while a long-term investor prefers daily or weekly views to spot broader trends.
Adding and adjusting technical indicators lets you tailor analysis precisely. Popular tools like Moving Averages, RSI, and Bollinger Bands can be applied and fine-tuned in real time. A trader studying USD/NGN forex pair might set RSI to 14 periods and shift Bollinger Bands parameters for volatility insights. Adjusted indicators help confirm trade signals and improve decision-making.
Saving templates for quick access ensures efficiency during active trading sessions. After setting your preferred charts and indicators, you can save the entire setup as a template. Next time you trade, a couple of clicks will load your favourite layouts without rebuilding from scratch. This is especially useful during high-volatility periods, such as ember months, when market action demands fast reaction.
Setting up TradingView charts on Deriv is more than just a routine step; it’s a strategic move that helps you trade smarter by keeping all analysis tools in one place and ready to go.
Effective trading on Deriv demands keen insight into market movements, and TradingView indicators provide invaluable tools for this. They help traders spot trends, gauge momentum, and time entry or exit points better. Given the variety, focusing on a few robust indicators like moving averages, RSI, and Bollinger Bands can sharpen your analysis.
Moving averages smooth out price data, making it easier to identify the overall direction of a market. The Simple Moving Average (SMA) calculates the average price over a set period, say 50 or 200 days, providing a clear view of the trend. On the other hand, the Exponential Moving Average (EMA) gives more weight to recent prices, responding quicker to current market changes.
For example, on the Deriv platform, pairing the 50-day SMA with the 20-day EMA can reveal momentum shifts. When a shorter EMA crosses above the longer SMA, it often signals an upward trend starting. These crossovers are widely used by traders to decide when to buy.
RSI is a momentum oscillator that measures the speed and change of price movements on a scale from 0 to 100. Typically, levels above 70 indicate an overbought market, while below 30 suggests oversold conditions. Using RSI on Deriv charts helps traders avoid buying into a market that's too stretched.
For instance, during a spike in forex trades on Deriv, if the RSI hits 75, it warns the currency pair may soon face a pullback. Traders who spot this can hold back on buying or prepare to sell, improving risk management.
Bollinger Bands consist of a moving average and two bands set above and below it at standard deviations. They reflect volatility—when the bands widen, the market is more volatile; when they contract, volatility is low.
On Deriv, Bollinger Bands can highlight price breakouts. If the price consistently touches the upper band, it suggests strong buying pressure, while touches at the lower band indicate selling pressure. For example, during naira volatility periods, monitoring these bands can alert traders to moments when price might reverse or accelerate sharply.
Identifying when a trend starts or ends is vital for timing trades on Deriv. Indicators like moving averages help show trend direction clearly. For example, if the price stays above the 200-day SMA, the market is generally bullish.
Reversal signals also come from patterns in RSI or Bollinger Bands. An RSI dropping from overbought towards middle territory might hint at a trend change. Recognising these early can save a trader from losses or capture new opportunities.
Markets don’t move smoothly; they often get stretched in one direction before correcting. Overbought means prices have risen too fast and may soon fall; oversold means prices have dropped sharply and might bounce back.
On Deriv, keeping an eye on RSI values or how price behaves near Bollinger Bands enables you to spot these extremes. For instance, an RSI below 30 during heavy trading on a commodity suggests a potential buying opportunity as the asset could rebound.
Relying on a single indicator can be risky. The best practice is to use two or more to confirm signals. For example, a trader might wait for both an EMA crossover and an RSI moving out of the overbought range before entering a trade on Deriv.
This approach reduces false signals. Suppose Bollinger Bands show a breakout but RSI stays neutral; it might be wise to hold back. Combining tools brings greater confidence to your decisions and helps you manage risk better.
Successful trading on Deriv means using indicators not as crystal balls but as guides. They empower you to interpret the complex market dance with clearer eyes and steadier nerves.
Use these TradingView indicators wisely to spot real opportunities and avoid hasty decisions often caused by market noise.
Using TradingView charts effectively on Deriv requires more than just understanding the technical tools; it demands a disciplined approach to trading. These practical tips help you build a strong strategy, avoid common pitfalls, and make consistent profits. When you develop a clear plan and manage risks carefully, the quality of your trades improves significantly.
Setting realistic goals and limits is essential for steady progress. For instance, aiming to double your capital every month is usually unrealistic and invites unnecessary risk. Instead, set achievable targets like earning 5-10% profit per week. Knowing when to take profits or cut losses stops emotions from controlling your trades. Setting limits forces you to stay disciplined, which is vital for long-term success with TradingView signals on Deriv.
Managing risk through stop-loss orders protects you from heavy losses. If you're trading CFDs or binary options, use stop-losses to automatically close positions when the price hits a certain level. For example, if you enter a trade on the EUR/USD pair at ₦500,000 and want to limit loss to ₦50,000, a stop-loss order ensures you don’t lose more if the market moves against you. This tool helps avoid the dreaded situation of emotional decisions that could drain your funds.
Keeping a trading journal for review lets you track patterns and mistakes. Record every trade’s entry, exit, rationale, and outcome. Over several weeks, you’ll spot which chart signals from TradingView turn out reliable and which setups tend to fail. This insight empowers you to tweak your approach and trade smarter on Deriv. For example, you might realise that a particular indicator combined with certain timeframes works better for you.
Over-reliance on indicators alone often leads to confusion. Indicators like RSI or Bollinger Bands are valuable but shouldn’t be the sole reason to execute trades. Market sentiment, volume, and price action also matter. For instance, relying only on RSI to buy could fail if strong news moves the market swiftly in the opposite direction. Integrating multiple factors increases confidence and reduces false signals.
Neglecting market news and events can wipe out profits quickly. Economic releases like Nigeria’s inflation report, CBN policy announcements, or global issues such as US oil stock changes have powerful effects on trading assets available on Deriv. Even the most accurate TradingView chart might miss sudden moves caused by these. Stay updated through Nigerian financial news platforms to align your trades with market reality.
Failing to adjust to changing market conditions is a common trap. A strategy that works well during stable times might struggle in volatile markets, such as during ember months when market behaviour shifts. Traders must be flexible, adjusting chart settings, timeframes, or the instruments they trade based on current trends. For example, narrowing time intervals or switching from CFDs to binary options during shaky periods might reduce risk.
Success with TradingView charts on Deriv is not about following signals blindly but combining smart planning, risk control, and awareness of broader market conditions. Apply these tips consistently, and your trading will become more durable and profitable.
Trading on Deriv with TradingView charts offers great potentials, but having access to extra learning resources and support tailored for Nigerian traders can make a big difference. These resources help you understand platform tools better, keep up with market changes, and navigate the unique trading environment in Nigeria. From official tutorials to local trading communities, accessing the right information helps avoid costly mistakes and sharpens your decision-making.
The TradingView help centre and guides offer comprehensive materials to master chart features and indicators. Whether you struggle with technical line tools or want to set up custom alerts, the guides walk you through each step clearly. Nigerian traders benefit by trimming down trial-and-error time, especially since TradingView's interface can seem overwhelming at first.
On the other hand, Deriv customer support and community forums provide practical, platform-specific guidance. Deriv’s customer care via live chat and email helps resolve issues like chart loading errors or trade execution delays quickly. Besides, community forums connect traders worldwide, including Nigerian users, sharing experiences and strategies. These forums are goldmines for real-world tips and troubleshooting advice that often aren’t found in official manuals.
Another valuable source is Nigerian trading groups and social media channels dedicated to forex, binary options, and crypto on Deriv and TradingView. These groups on platforms like Telegram, WhatsApp, and Facebook create space for timely discussions on liquidity, Nigerian market peculiarities, and platform updates. For example, a trader might discover an insider tip about a naira currency fluctuation affecting CFD prices, shared firsthand by a local member.
Nigeria’s trading landscape requires awareness of NAICOM (National Insurance Commission) and SEC (Securities and Exchange Commission) rules, especially for financial instruments regulated within the country. Understanding these bodies’ guidelines protects you from inadvertently trading banned assets or falling foul of licensing requirements. Compliance ensures your trading activity aligns with the law, helping avoid sanctions and account freezes.
Following CBN (Central Bank of Nigeria) forex guidelines is critical too. The CBN monitors foreign exchange flows, and regulations sometimes affect access to foreign currency for trading. Traders using Deriv must stay alert to CBN policy changes, such as limits on dollar purchases or restrictions on outward remittances. These regulations influence how you fund your account or repatriate profits.
Lastly, adapting to Nigerian market dynamics improves trading success. Factors like naira volatility, fuel scarcity affecting power supply to servers, or political events during election seasons can sway asset prices unexpectedly. Savvy traders incorporate these realities into their strategies rather than relying solely on technical charts. This practical approach helps manage risks and capitalise on local opportunities.
Using extra resources and keeping up with local rules is not just about compliance—it’s about building a strong foundation for profitable, informed trading on Deriv with TradingView in Nigeria.
By exploring tutorials, engaging with communities, and respecting regulations, Nigerian traders can harness TradingView charts on Deriv more effectively and confidently.
🚀 Learn how to combine TradingView & Deriv for smarter trading in Nigeria. Get tips on setup, chart tools, indicators, and real-time market analysis!

📊 Master TradingView with Deriv in Nigeria! Learn to use indicators, set up charts, and boost your trading skills with this detailed guide.

📊 Learn how to connect TradingView charts with Deriv for smarter trading decisions. Tips, benefits, and troubleshooting included to boost your trading game!

📊 Discover how TradingView & Deriv boost trading skills for Nigerian traders. Learn tools, integration tips & strategies for smarter market moves.
Based on 9 reviews