
MetaTrader Guide for Nigerian Traders
MetaTrader forex guide for Nigerian traders 🇳🇬 Learn how to install, use key tools, place orders, and handle local challenges for safer trading with ₦ in mind.
Edited By
Sophie Clarke
Trade charts form the backbone of market analysis for many Nigerian traders. They offer a visual snapshot of price movements, helping to decode complex market shifts into understandable patterns. Whether you trade in the stock market, forex, or commodities like cocoa and crude oil, charts are indispensable tools.
A typical trade chart displays data over time, revealing trends more vividly than raw numbers could. For example, if you buy shares on the Nigerian Exchange (NGX), watching the candlestick pattern on a price chart over days or weeks guides you on when to hold or sell.

In Nigeria's vibrant markets, where local events like fuel scarcity, political developments, or CBN monetary policies can swiftly affect prices, reading charts becomes even more valuable. They help you react promptly to market sentiment shifts triggered by such local factors.
Understanding the key components of trade charts is the first step towards making informed trading decisions. These charts distil price data into formats that highlight movement, momentum, and market strength.
Price Axis (Vertical): Shows the asset’s price levels, usually in ₦ for Nigerian markets
Time Axis (Horizontal): Displays the chronological timeline — minutes, hours, days, or months
Candlesticks or Bars: Indicate the opening, closing, high, and low prices within a selected period
Volume Bars: Show how much trading activity happened, offering clues on market interest
Using this information, traders can spot if a stock or forex pair is trending upwards, facing resistance, or about to reverse. For instance, noticing a sharp volume spike alongside rising prices could mean buyers are actively pushing up demand.
In Nigeria, many traders use platform charting tools like those from GTBank’s investment platform or MTN’s mobile trading apps, which incorporate real-time data and chart types geared toward local preferences.
The better you understand these charts, the more confidently you can navigate Nigeria’s often volatile markets. This guide is structured to breakdown chart types, reading tips, and pitfalls to avoid so you make the most of your trades.
Next, we will explore the common types of trade charts and how each serves different trading styles and objectives.
Trade charts are indispensable tools that lay bare the movements of prices over time, providing a visual window into market behaviour. For Nigerian traders juggling multiple factors—from naira fluctuations to political announcements—understanding what trade charts display is critical for making informed decisions and managing risk effectively.
These charts distil complex market data into readable visuals that map out price shifts, volume changes, and timelines. This clarity makes it easier to predict future movements rather than just reacting to sudden market shocks. For example, a trader following the shares of Dangote Cement may spot a price surge caused by quarterly earnings release simply by watching the chart's price movement and volume spikes.
Price Movement
Price movement tracks how the value of a security, commodity, or currency fluctuates. On a Nigerian stock exchange (NGX) chart, this translates to the daily or intraday changes in stock prices, reflecting supply and demand. Price movement helps traders assess whether an asset is gaining or losing traction. For instance, a steady upward movement in MTN Nigeria's share price could indicate increased investor confidence.
Timeframe
The timeframe determines the period each data point on the chart represents—ranging from minutes to months. Day traders might prefer short timeframes like 5-minute or 15-minute charts to capture rapid market swings, while investors looking at long-term gains will study weekly or monthly charts for broader trends. Choosing the right timeframe in Nigerian markets is especially important because economic news or government policy updates can quickly shift prices.
Volume Indicators
Volume indicators show the number of shares or contracts traded within a specific timeframe. High volume often confirms price moves; for example, a price increase in Nigerian bank shares accompanied by rising volume suggests genuine buying interest. Conversely, price movements on low volume may indicate weaker conviction. Paying attention to volume helps traders avoid false signals common in volatile Nigerian market conditions.
Spotting Trends
Trend identification is a fundamental use of trade charts. These trends reveal the overall direction of the market or a specific asset, whether up, down, or sideways. Recognising when Dangote Sugar begins an upward trend allows traders to ride the momentum for profit. Conversely, spotting a downtrend early helps cut losses or short-sell.
Identifying Support and Resistance
Support levels act as a floor where prices tend to stop falling, while resistance levels act as a ceiling limiting upward moves. In Nigerian markets, these levels can form around key economic events or earnings reports—for example, the NGX All-Share Index might repeatedly bounce off a particular point, signalling strong support.
Understanding these zones helps traders set stop-loss orders and anticipate price reversals, crucial for managing risk.
Timing Entry and Exit Points
Trade charts assist in pinpointing when to enter or exit trades. Entry timing involves buying when the price shows signs of upward movement after hitting support or breaking resistance. Exit timing ensures profits are locked in or losses limited. For instance, a trader might sell shares of a petroleum company after noticing a reversal pattern on the chart following positive fuel subsidy news in Nigeria.
Mastering what trade charts reveal can turn guesswork into calculated decisions, significantly improving trading outcomes in the dynamic Nigerian market.
Trade charts are the lifeblood of any serious trader, especially in Nigeria’s dynamic markets. Understanding the most common chart types helps traders interpret price movements clearly and make informed decisions. Each chart offers a unique angle on price behaviour, catering to different trading styles and timeframes.
Line charts are the simplest form of trade chart. They connect closing prices over a chosen period with a continuous line, offering a clear view of the overall price trend. For Nigerian traders dealing with equities listed on the Nigerian Stock Exchange (NGX) or commodities like oil and cocoa, line charts provide a straightforward snapshot without much clutter.
Though basic, line charts help identify long-term trends or significant support and resistance levels. For example, a trader monitoring MTN Nigeria’s share price might use line charts to spot gradual uptrends or downtrends before drilling down into more detailed chart types. Their simplicity makes line charts ideal for beginners or traders focusing on big-picture movements rather than short-term volatility.
Bar charts add more information than line charts by displaying the opening, high, low, and closing prices for each trading period. Nigerian traders often use bar charts for market segments with high intraday volatility, such as forex pairs like USD/NGN or commodities traded on global platforms.
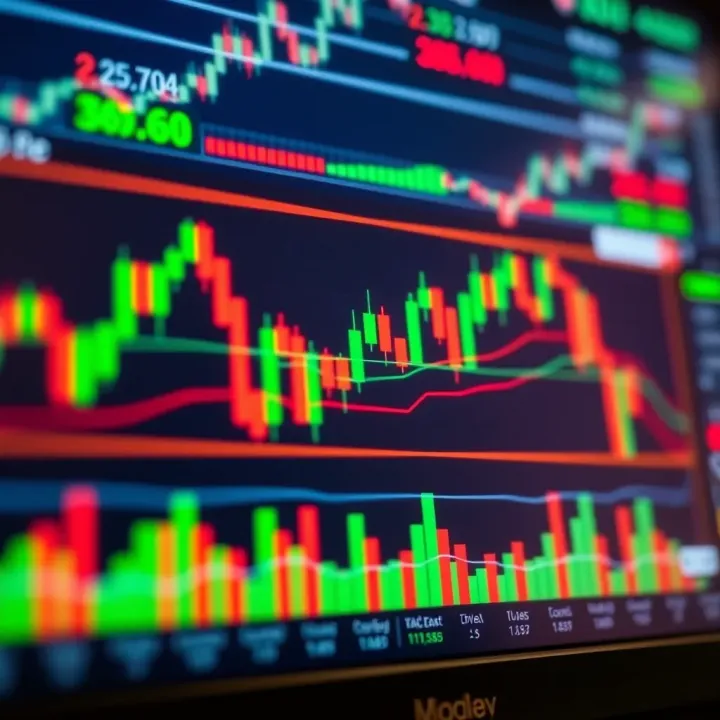
Each vertical bar represents the price range within the timeframe, with horizontal ticks showing open and close levels. This format helps traders assess market momentum and identify reversal points. For instance, if the price closes near the high of the bar consistently, this suggests strong buying interest. Bar charts serve as a middle ground between simplicity and detail, giving traders a fuller picture without the complexity of candlestick charts.
Candlestick charts are arguably the most popular among Nigerian traders due to their rich visual information and pattern recognition capabilities. Each candlestick shows the opening, closing, high, and low prices for a specific period — just like bar charts — but with a colour-coded body.
A filled (usually red or black) body signals the closing price was lower than the opening, indicating selling pressure. Conversely, a hollow or green candle shows a price increase for the period. The "wicks" or shadows above and below the body represent the highest and lowest prices reached. This structure offers immediate insights into market sentiment.
Candlestick patterns help traders spot potential reversals or continuations in trends. Some widely observed patterns in Nigerian markets include:
Hammer and Hanging Man: These appear after a downtrend or uptrend respectively and signal possible reversals. A hammer, with its long lower wick and small body, suggests buying interest after sellers pushed prices down.
Engulfing Patterns: A bullish engulfing pattern occurs when a small red candle is followed by a larger green candle that completely covers it. This indicates strong buying momentum, potentially signalling a good entry point.
Doji: This pattern shows indecision where the opening and closing prices are nearly the same. For Nigerian traders, spotting a Doji after a strong trend can warn of a possible market pause or reversal.
Recognising these patterns is essential for timing trades effectively, especially in a market known for sudden shifts like Nigeria’s. For instance, traders using candlestick analysis on agricultural commodity prices can anticipate price shifts around harvest seasons or import policy changes.
Mastering these chart types and their patterns equips Nigerian traders to adapt better to market fluctuations and avoid common mistakes like chasing false breakouts.
In summary, line charts offer clarity for broad trends, bar charts provide better intraday price detail, and candlestick charts combine both with powerful visual and pattern cues. Knowing when and how to use each helps Nigerian traders sharpen their strategies and manage risks more effectively.
Interpreting trade chart data correctly gives you a clearer edge in the Nigerian market, where volatility and sudden shifts can catch traders off guard. Beyond just looking at price trends, combining chart information with technical indicators sharpens your insight into market behaviour. This section explains how you can read charts more effectively by pairing them with indicators and spotting market sentiment through key chart patterns.
Moving averages smooth out price data to help you identify the direction of a trend over a period. For example, a 50-day moving average tells you the average closing price over the last 50 trading days, which you can compare to the current price. When the price crosses above the moving average, it might signal a buy opportunity, while a drop below could mean it’s time to sell. Nigerian stocks or forex pairs often show clearer signals when you track short-term (like 10-day) and long-term (like 200-day) averages side by side.
The Relative Strength Index is a momentum oscillator that measures how quickly prices rise or fall. It ranges from 0 to 100, with readings above 70 indicating overbought conditions and below 30 suggesting oversold levels. For example, if a stock like MTN Nigeria Plc suddenly hits an RSI above 70, it could be due for a price correction. Traders watching the Nigerian Exchange Group (NGX) sometimes use RSI to avoid buying at peak prices during ember months, when markets can be erratic.
Volume oscillators analyse trading volume changes to confirm price moves or warn of reversals. If a price rises but volume drops, it signals weak investor interest and raises caution. On Nigerian platforms like Bamboo or Trove, watching volume alongside price action helps avoid traps where prices pump up without real buying power behind them. Volume oscillators can alert you when a favourite stock or forex pair is losing steam despite upward price trends.
Recognising bullish or bearish patterns signals whether buyers or sellers dominate the market. A bullish pattern, such as a hammer candlestick after a price dip, suggests buyers are stepping in, often leading to the price rising. In contrast, a bearish engulfing pattern could warn sellers have taken control. For Nigerian investors, these signals help in timing trades during periods affected by political news or economic updates.
Breakouts occur when prices move beyond established support or resistance levels, indicating possible new trends. However, false breakouts trick traders by briefly moving past these levels before reversing. In Nigeria’s often volatile stock and currency markets, False breakouts are common during major economic announcements or after market rumours. Confirming a breakout with strong volume and additional indicators reduces the risk of acting on false signals.
Successful interpretation of trade charts lies in combining various tools and understanding the market context, especially in Nigeria, where local factors heavily influence price movements.
By mastering indicators and reading market sentiment through patterns, you can improve your trading decisions and safeguard your investments against sudden market turns.
Using trade charts effectively in Nigerian markets requires more than just understanding the basics. This section focuses on practical advice tailored to the unique trading environment here, helping you make smarter decisions and avoid common mistakes.
Selecting the suitable chart timeframe is vital because it aligns with your trading goals and risk appetite. For instance, day traders typically monitor 5-minute or 15-minute charts to catch quick price movements in stocks like Zenith Bank or MTN Nigeria. Swing traders, on the other hand, find daily charts more useful for spotting broader trends over several days or weeks. If you’re more conservative, weekly charts give a bigger picture and reduce noise from short-term fluctuations. Picking the wrong timeframe can lead to missed opportunities or unnecessary risks, so always match your choice to how fast or slow you want to trade.
Nigerian markets often show bouts of volatility, especially around major economic announcements or during ember months when trading activity spikes. Liquidity in stocks listed on the Nigerian Exchange (NGX) can vary significantly. Blue-chip stocks like Dangote Cement usually have higher liquidity, but smaller companies may suffer from thin trading volumes, causing price jumps or gaps in charts. Understanding this helps traders avoid false breakouts or misinterpretations of volume spikes. For example, a sudden surge in volume in a low-liquidity stock might reflect just one or two big trades, not a trend.
Economic policies from the Central Bank of Nigeria (CBN) or announcements on fuel subsidy changes can cause sudden market shifts. Similarly, political events such as elections or government reshuffles often influence investor sentiment quickly. As a trader, integrating chart analysis with the timing of such news is key. For example, before a scheduled CBN monetary policy rate announcement, expect increased volatility; adjusting your stop-loss and take-profit points can minimise losses. Ignoring these events might lead you to misread market moves as purely technical when they’re actually news-driven.
Indicators like moving averages or the Relative Strength Index (RSI) are handy, but relying solely on them can mislead you. Markets don’t always behave as indicators suggest; for instance, RSI might show overbought levels, but the price could still rise due to strong demand. A trader focusing only on indicators without considering price action risks making poor timing decisions. Always use indicators as one part of your analysis, confirming with chart patterns and volume.
Charts don’t exist in a bubble. Nigerian markets react to local factors such as naira exchange rate fluctuations, power supply issues affecting companies, or security challenges in certain regions. For example, a stock’s downtrend could be related to industry-wide difficulties rather than company-specific problems. Ignoring such context might make you exit a position prematurely or hold on to a losing trade.
Volume helps confirm price moves, but misinterpreting it can cause errors. In Nigeria, sudden high volume may result from institutional moves or corporate announcements, not necessarily broader market interest. For example, a spike in volume during a stock’s price rise might indicate a big player accumulating shares—but equally, it might signal insiders offloading before bad news. Look for volume trends over several sessions rather than isolated spikes to gauge genuine strength.
Effective trading in Nigeria demands a balanced approach: combining technical charts with local market knowledge and caution around common mistakes. This way, you stand a better chance of navigating the ups and downs confidently.
By applying these practical tips, Nigerian traders can sharpen their skills and respond better to the quirks of our market environment, improving trade success over time.
Trade charts become powerful tools when paired with the right platforms that deliver timely, accurate market data. Nigerian traders need tools that cater to local market conditions, transaction methods, and reliable information sources. Platforms offering chart access not only visualise price movements but also integrate news, alerts, and analytics to sharpen trading insights.
Many Nigerian brokers now provide built-in charting tools tailored for trading on the Nigerian Stock Exchange (NGX) and local commodities. These platforms often include real-time price updates for Nigerian equities, government bonds, and currencies like the naira. For instance, brokers such as Meristem Securities and ARM Securities offer proprietary platforms or partner with charting providers, allowing users to analyse NGX price movements directly.
Local broker platforms have the advantage of understanding Nigerian market peculiarities, such as how embargoes or local monetary policies impact price behaviour. Traders can also benefit from seamless trade execution linked to these charts, avoiding the hassle of switching between separate tools for analysis and trading.
Apart from local services, Nigerian traders increasingly turn to global charting platforms like TradingView, MetaTrader 4/5, and Thinkorswim for deeper technical analysis. These platforms offer extensive chart customization, advanced indicators, and access to multiple asset classes including forex, commodities, and international stocks. Traders who use platforms like FXTM or IG Markets also enjoy robust charting combined with global market news.
While these global platforms cover Nigerian-listed assets to a limited extent, they shine in cross-asset strategies. Plus, their mobile apps and cloud-based accounts make it easy for Nigerian traders to track charts anytime, anywhere, even during heavy Lagos traffic or power fluctuations.
Chart data alone doesn’t tell the whole story. Integrating real-time news feeds and economic calendars with charts helps traders understand the reasons behind price moves. Nigerian traders should monitor sources like Bloomberg Nigeria, The Guardian Business, or CBN announcements closely alongside their charts. Economic calendars provide dates for key events such as CBN monetary policy meetings, inflation reports, or oil production updates — all of which influence market sentiment and chart patterns.
Having this information alongside charts reduces surprises. For example, a sudden naira depreciation visible on the chart can be quickly checked against recent trade or monetary policy announcements, helping traders avoid knee-jerk reactions.
Mobile apps are indispensable for Nigerian traders who face busy schedules and frequent power or connectivity interruptions. Platforms like Kuda, OPay, or local broker apps provide push notifications for price alerts, breaking news, or indicator triggers. These instant notifications are helpful in Nigeria’s fast-moving markets, enabling prompt responses without constantly refreshing charts.
Additionally, custom alerts set within charting platforms help traders follow specific price levels or chart patterns. For example, setting an alert for when an NSE stock hits a resistance level lets a trader prepare exit or entry decisions, even when offline.
Choosing the right combination of charting tools and supplementary resources makes trading in Nigerian markets more informed and responsive. The key is to blend local market insight with reliable technology to stay ahead.
MetaTrader forex guide for Nigerian traders 🇳🇬 Learn how to install, use key tools, place orders, and handle local challenges for safer trading with ₦ in mind.

Discover how OctaFX serves Nigerian traders with clear account types, strong regulation, and trusted platforms. Get practical advice for safe forex trading 💹💰

Discover how to trade on IQ Option safely and smartly in Nigeria 🇳🇬! Learn about accounts, strategies, risks, and regulations to maximize your ₦ investments today.
🔐 Learn how to log in to Deriv securely, set up your account, fix login issues, and manage internet challenges while trading from Nigeria. 📱💻
Based on 5 reviews