

Master Trading Chart Patterns with Practical PDF Guides
Learn essential trading chart patterns to spot market moves and boost your ₦ gains. Get practical tips plus handy PDFs to sharpen your trading skills 📈📊.
Edited By
Amelia White
Chart patterns offer a straightforward way to read price movements in financial markets. Traders and investors in Nigeria increasingly use these patterns to make informed decisions, especially when markets can be volatile or influenced by unpredictable factors like naira fluctuations or geopolitical events.
At its core, a chart pattern is a formation on price charts reflecting the battle between buyers and sellers. These patterns help anticipate future price directions based on historical behaviour, not guesswork. For example, a head and shoulders pattern often signals a market reversal, while a triangle pattern may suggest an upcoming price breakout.
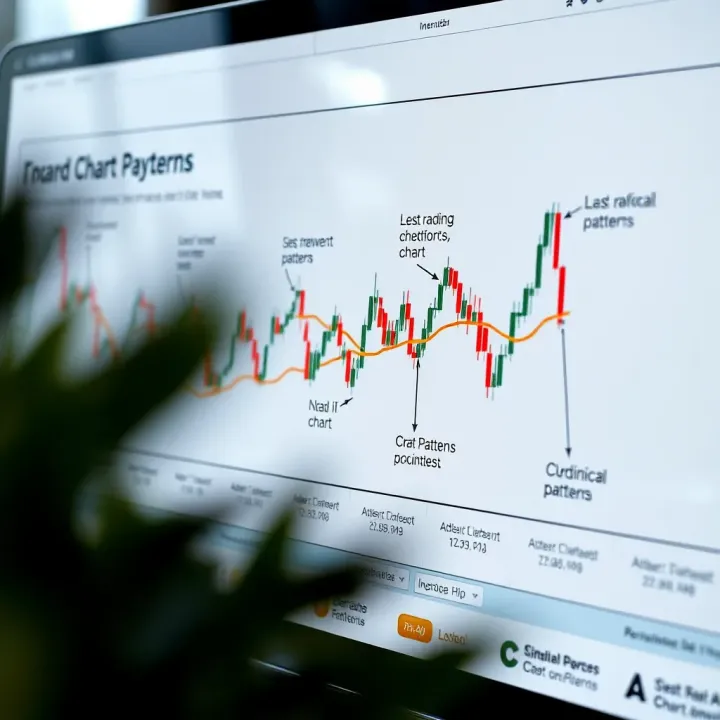
Understanding these patterns isn’t just academic; it helps you spot when to enter or exit trades. Practical skills in recognising chart patterns can improve your timing and reduce losses. Nigerian traders familiar with electric power instability and fuel costs know the value of precise timing to avoid holding positions through bad spells.
Mastering chart patterns equips you with a clearer view of likely market moves, helping you trade smarter — not harder.
Many pattern types fall into two broad groups:
Continuation patterns: These suggest the current trend will continue. Examples include flags and pennants.
Reversal patterns: These indicate a likely trend change, like double tops or cup and handle.
While these patterns appear simple on a screen, their real value lies in combining them with Nigerian market context—such as fund flow from local banks or foreign portfolio movements on the NGX (Nigerian Exchange Group). That’s why alongside learning patterns, accessing PDF resources with annotated Nigerian market examples serves as an important study tool.
In this guide, you will find clear explanations about key chart patterns relevant to the Nigerian market environment. You’ll learn how to use reliable PDF resources for deeper learning and practical application, enabling you to make better trading or investment decisions.
Next sections will unpack specific chart patterns with examples from Nigerian stocks, forex pairs like USD/NGN, and commodities frequently traded locally. This approach ensures you not only read charts but understand their real-world Nigerian market impact.
Chart patterns form the backbone of technical analysis, helping traders read past price movements to forecast possible future trends. For those involved in trading stocks, forex, or commodities on platforms like the Nigerian Stock Exchange (NGX) or local forex markets, understanding these patterns is key to making informed decisions. They offer a visual language by which you can interpret market psychology and price action without relying solely on news or fundamentals.
At their core, chart patterns are shapes or formations created by plotting price movements on a graph over time. These shapes emerge from the collective behaviour of market participants—buyers and sellers reacting to supply, demand, and external factors. Common examples include the 'head and shoulders' pattern, which signals a potential trend reversal, and 'flags' or 'pennants' that suggest a continuation of the current trend.
Picture a scenario where a stock listed on NGX climbs steadily before forming a peak flanked by two lower peaks—this is a classic head and shoulders pattern, often indicating that the uptrend may soon end. Recognising this pattern early could help you exit your position before the price falls, thereby protecting your capital.
Chart patterns serve as practical tools that guide entry and exit points, stop-loss placements, and profit targets. Unlike relying purely on gut feeling or sporadic news reports, these patterns provide structure and consistency to trading strategies.
For Nigerian traders, especially those active in volatile markets often affected by local economic shifts and naira fluctuations, chart patterns offer a way to navigate uncertainty. When combined with other indicators—say, volume analysis or moving averages—they help reduce the guesswork and improve risk management. For example, spotting a 'double bottom' pattern might signal a solid support level, increasing your confidence to buy or hold a particular stock.
Successful trading often depends on reading these patterns accurately and responding swiftly—developing this skill changes how you view price charts, turning them from confusing lines into actionable market signals.
Understanding chart patterns is a practical step towards mastering the market's signals. In subsequent sections, this guide will unpack common patterns, show how to use PDF resources to learn them better, and provide case studies relevant to Nigerian traders.
Chart patterns form the backbone of technical analysis, helping traders predict price movements by observing market behaviour. Recognising these patterns can sharpen your timing—knowing when to enter or exit trades can make a significant difference in your returns. Here, we focus on three main types of patterns widely used by traders: continuation, reversal, and neutral patterns.

Continuation patterns suggest that the current trend will likely keep moving in the same direction after a brief pause. Flags and pennants fall into this category. A flag looks like a small rectangle slanting against the trend, forming after a strong price move. For example, if the Nigerian Stock Exchange (NSE) shares have rallied sharply, a flag pattern might form during a short break before resuming upward.
Pennants look like small triangles and appear after a strong move as well. Both patterns signal a “rest period” before the price continues in the current trend’s direction. Practical use? If you spot a flag or pennant during an uptrend in shares like Nestlé Nigeria or Dangote Cement, you might prepare to buy, expecting the price to rise further.
Reversal patterns warn that the current trend may be about to change direction. The head and shoulders pattern is a classic example, often signaling a peak is near. It consists of three peaks: a higher peak (head) flanked by two lower peaks (shoulders). If you spot this on the price chart of, say, MTN Nigeria, it might hint that the bullish rally is running out of steam.
Double tops and bottoms work similarly. A double top forms when price hits a high twice but can’t break through, suggesting a downturn is coming. Conversely, a double bottom signals a possible bullish reversal after two lows. Traders should watch for confirmation like breakouts below or above the pattern before acting.
Neutral patterns don’t point to clear direction but signal a period of indecision. Triangles, whether symmetrical, ascending, or descending, show that price is consolidating and volatility is tightening. This often comes before a significant move, but it could break either way.
Wedges are similar but typically suggest a reversal. An ascending wedge during an uptrend may hint at a bearish reversal, while a descending wedge in a downtrend could predict a bullish turn.
Understanding these patterns is key to spotting potential profits or avoiding losses. Ignoring them can leave you drifting like an okada without direction in Lagos traffic.
In summary, knowing flags and pennants helps you ride trends longer, reversal patterns alert you to changing tides, and neutral patterns prepare you for possible breakouts. Using these, alongside other signals, makes your trading approach smarter and more informed.
Using chart pattern PDFs serves as a valuable tool for traders and investors aiming to sharpen their technical analysis skills. These PDFs typically compile well-organised charts, examples, and explanations of various price patterns that can signal trend continuation, reversal, or consolidation. For Nigerian traders who may not always have steady internet access, downloadable PDFs provide an offline, structured reference that can be consulted anytime, whether at a cybercafé or on a mobile device without data.
Accessing trustworthy chart pattern PDFs is essential to avoid misinformation or outdated strategies. Reputable sources include established financial education websites, brokerage firms with local presence, and recognised trading academies. For example, Nigerian brokers such as Stanbic IBTC often provide educational materials including chart pattern guides. Global platforms like Investopedia and BabyPips also offer downloadable PDFs that explain patterns in simple terms. Avoid random PDFs found on forums or file-sharing sites as these may lack accuracy.
When selecting a PDF, look for recent updates reflecting current market conditions and examples with clear graphical illustrations. Some providers tailor content for specific markets, like the Nigerian Stock Exchange or forex trading, which makes the material more relevant. If you prefer practical content, PDFs that include quizzes or exercises can reinforce learning.
PDFs are best used as part of a structured learning routine. Start by reading through pattern definitions and their trading implications, paying close attention to key signals like breakout points and volume changes. Mark or highlight examples to revisit later. Create notes on distinctions between similar patterns — for instance, flags versus pennants — to avoid confusion.
Apply what you learn by reviewing live charts alongside the PDF. Many Nigerian traders use free charting platforms like investing.com or MT4 to practise spotting patterns in real-time. You can pause on PDF illustrations and try identifying them on these platforms, developing your detection skills step-by-step.
Moreover, working through practice scenarios in PDFs helps build confidence. If a PDF offers self-tests or scenario questions, actively attempt these to assess your understanding. This method helps prevent common mistakes, such as misreading false breakouts.
Using chart pattern PDFs as a consistent study tool can significantly improve your technical analysis accuracy, helping you make better trading decisions in complex markets.
Organising your PDF resources by type of pattern or market can also speed up revision sessions. Regular review during ember months, when market volatility tends to spike, keeps your skills sharp. Combining these PDFs with other learning materials like videos or live webinars provides a well-rounded approach to mastering chart patterns.
Chart patterns are not just theoretical tools but have practical value when applied to the Nigerian Stock Exchange (NGX) and Forex markets. Traders here can gain an edge by recognising patterns that reveal shifts or continuations in price trends amid Nigeria's unique market conditions. For instance, volatility caused by macroeconomic news, Central Bank of Nigeria (CBN) policies, or changes in oil prices can cause sharp movements, making chart patterns especially useful for timing trades.
To successfully use chart patterns in Nigeria, it helps to understand local market nuances. The NGX often experiences periods of low liquidity, which can cause price spikes or false breakouts. Therefore, Nigerian traders should combine chart patterns with volume analysis to confirm signals. For example, a classic 'head and shoulders' pattern on a Nigerian stock like Dangote Cement needs accompanying volume data to validate the reversal signal.
In the Forex market, pairs such as USD/NGN tend to show strong reactions to government announcements and foreign exchange policies. Here, patterns like flags or pennants can signal continuation after a sharp move caused by policy changes. Yet, unlike more liquid global markets, the FX market in Nigeria sometimes reflects delays or restrictions in currency flows, so traders should be cautious about false breakouts.
Traders should also consider the lower trading hours in Nigeria, as NGX operates mainly from 9:30 am to 2:30 pm WAT, which can affect pattern formation and interpretation compared to markets with longer hours.
A good example comes from the telecom sector during the 2023 ember months. A trader spotted a double bottom pattern on MTN Nigeria's stock chart after months of decline. Recognising the potential reversal, they entered a position which yielded a 15% gain within six weeks as the stock regained investor confidence following a positive earnings report.
Another case involved Forex traders capitalising on the USD/NGN pair during the 2022 currency devaluation. The appearance of bullish flag patterns helped traders decide on entry points as the naira weakened sharply. Those who timed their trades alongside these patterns secured profits amid an otherwise volatile environment.
Applying chart patterns while considering local factors like market hours, liquidity, and policy-driven volatility increases your chances of consistent success.
Combining these lessons with PDF resources on chart patterns can reinforce traders’ ability to spot opportunities in Nigeria’s dynamic markets. By adapting global technical analysis tools to domestic realities, Nigerian traders and investors can improve decision-making backed by practical, data-driven insights.
Mastering chart pattern recognition is essential for traders who want to make smarter decisions in the market. Practically, this skill helps you spot trends early, avoid costly mistakes, and better time your entry or exit. In Nigeria, where markets like the Nigerian Stock Exchange or Forex can be volatile, accurate pattern reading can be the difference between profit and loss. By sharpening your ability to identify patterns like head and shoulders or flags, you gain a clearer picture of price movement and potential market direction.
One frequent mistake traders make is confusing noise for genuine patterns. Markets, especially local ones, often show brief price fluctuations that look like patterns but are just random movements. For example, a trader might misinterpret a few random highs and lows as a double top, leading to premature selling. To avoid this, always confirm patterns with volume data or other indicators and be patient until the pattern fully forms. Another error is ignoring the broader market context; a well-formed pattern in isolation might fail if the overall market trend contradicts it.
Traders also often overlook timeframes. A pattern on a 15-minute chart might not carry the same weight as one on a daily chart. Practise checking multiple timeframes to validate patterns before making decisions. Remember, overtrading on weak or incomplete patterns usually eats into your capital.
Chart patterns rarely tell the whole story alone. Using additional technical tools can improve your confidence and outcomes. For instance, combining moving averages with chart patterns can help confirm trend directions. If a bullish flag appears while the price is above a long-term moving average, this adds strength to the buy signal.
Similarly, the Relative Strength Index (RSI) can reveal whether a stock is overbought or oversold, helping you avoid false breakouts. Say you spot a break above a resistance level forming a triangle pattern, but the RSI shows overbought – caution is wise here to avoid getting trapped.
Volume is another critical factor. Genuine breakouts in patterns like head and shoulders usually come with increasing trade volume. In contrast, if volume remains low, the move might lack conviction.
Practical trading integrates chart patterns with volume, momentum, and trend indicators. This multi-layered approach reduces risks and sharpens your edge in navigating the market.
In summary, mastering chart pattern recognition in Nigerian markets means avoiding rushed conclusions, using multiple timeframes, and combining patterns with other technical tools. This method helps you cut through market noise, spot better trade opportunities, and protect your investments effectively.
Learn essential trading chart patterns to spot market moves and boost your ₦ gains. Get practical tips plus handy PDFs to sharpen your trading skills 📈📊.

📊 Understand margin in business & finance—types, calculations, risks, and trading roles explained. Learn how effective margin management boosts profitability.

📈 Discover how derivative trading helps Nigerian investors hedge risk and profit from price swings without owning assets. Learn types, strategies, and Nigerian market insights.
Learn how CFD trading works in Nigeria 🇳🇬, including benefits, risks, and tips for managing investments wisely in the ₦-zone. Ideal for savvy Nigerian investors!
Based on 14 reviews